

 French


Memblaze PBlaze7 7940 Avant
Performances de la série Memblaze PBlaze7 7940
Memblaze PBlaze7 7940 Fin
Capacités et facteurs de forme Memblaze PBlaze7 7940
Memblaze PBlaze7 7940 Couvercle
Fonctionnalités d'entreprise Memblaze PBlaze7 7940
Spécifications Memblaze PBlaze7 7940
| PBlaze7 7940 | PBlaze7 7946 | |||||
| Capacité utilisateur (To) | 3,84 | 7,68 | 15,36 | 3,2 | 6,4 | 12,8 |
| Facteur de forme | 2,5 pouces U.2, E3.S 1T, E3.S 2T, E1.S et HHHL AIC | |||||
| Interface | PCIe 5.0 x 4 | |||||
| Lecture séquentielle 128 Ko | jusqu'à 14 Go/s | |||||
| Écriture séquentielle 128 Ko | jusqu'à 10 Go/s | |||||
| IOPS de lecture aléatoire soutenue (4 Ko) | jusqu'à 2800K | |||||
| Écriture aléatoire soutenue (4 Ko) IOPS (état stable) |
|
|||||
| Endurance à vie DWPD |
|
|||||
| Latence R/W aléatoire | 55/9 µs | |||||
| Latence R/W séquentielle | 8/9 µs | |||||
| Température de fonctionnement | Ambiante : 0°C à 35°C avec flux d'air suggéré ; Boîtier : 0°C à 77°C | |||||
| Taux d'erreur de bit non corrigeable | < 10-17 | |||||
| Temps moyen entre les pannes | 2 millions d'heures | |||||
| Protocole | NVMe 2.0, OCP 2.0 | |||||
| Mémoire flash NAND | NAND TLC 3D | |||||
| Système d'exploitation | RHEL, SLES, CentOS, Ubuntu, Windows Server, VMware ESXi | |||||
| Consommation électrique | < 25 W | |||||
| Support de fonctionnalités de base | Protection contre les pannes de courant, protection complète du chemin de données, S.M.A.R.T, gestion flexible de l'alimentation, échange à chaud | |||||
|
Support de fonctionnalités avancées |
TRIM, Multi-namespace, chiffrement de données AES 256 et effacement cryptographique, EUI64/NGUID, gestion de la taille de secteur variable et protection des données de bout en bout NVMe (DIF/DIX), mise à niveau du firmware sans réinitialisation, horodatage, Weighted Round Robin, journal d'événements persistant, télémétrie, téléchargement sécurisé, démarrage sécurisé, TCG OPAL2.0, écriture atomique 128K, NVMe-MI, SR-IOV | |||||
| Support logiciel | Outil de gestion open-source, outil de débogage CLI, pilote intégré au système d'exploitation (intégration système facile) | |||||
SSD Gen5 Memblaze PBlaze7 7940 Performance
Banc d'essai
Pour tester le SSD Gen5 Memblaze PBlaze7 7940, nous avons utilisé le Dell PowerEdge R760 dans notre laboratoire de test. Le R760 est un serveur rackable 2U très polyvalent qui prend en charge deux processeurs Intel Xeon de 4e génération avec des configurations pouvant accueillir jusqu'à 24 disques NVMe. Ce serveur à usage général est destiné aux charges de travail mixtes, aux bases de données et à la VDI.
Configuration du Dell PowerEdge R760
- Double Intel Xeon Gold 6430 (32 cœurs/64 threads, 1,9 GHz de base)
- 1 To de RAM DDR5
- Ubuntu 22.04
Pour une flexibilité ultime, nous avons également travaillé avec Serial Cables, qui nous a fourni un JBOF PCIe Gen5 à 8 baies pour les tests de SSD U.2/U.3, M.2 et EDSFF. Cela nous permet de tester tous les types de disques actuels et émergents sur le même matériel de test.
Le Memblaze PBlaze7 7940 marque notre deuxième SSD Gen5 avec cette plateforme de test, après notre première expérience avec le KIOXIA CM7 (dont les résultats seront ajoutés aux graphiques ci-dessous). Notre comparaison de performances inclut également le SSD Gen5 Samsung PM1743. Notamment, le 7940 et le PM1743 ont chacun une endurance de 1 DWPD, contrairement au 3 DWPD du CM7-V.
Analyse des charges de travail VDBench
Lors du benchmarking des périphériques de stockage, les tests d'application sont les meilleurs, et les tests synthétiques sont les seconds. Bien qu'ils ne soient pas une représentation parfaite des charges de travail réelles, les tests synthétiques permettent de définir des bases pour les périphériques de stockage avec un facteur de répétabilité qui facilite la comparaison directe entre les solutions concurrentes. Ces charges de travail offrent une gamme de profils de test allant des tests « quatre coins » et des tests de taille de transfert de base de données courants aux captures de traces provenant de différents environnements VDI.
Ces tests utilisent le générateur de charge de travail vdBench courant, avec un moteur de script pour automatiser et capturer les résultats sur un grand cluster de test de calcul. Cela nous permet de répéter les mêmes charges de travail sur différents périphériques de stockage, y compris les baies flash et les périphériques de stockage individuels. Notre processus de test pour ces benchmarks remplit toute la surface du disque avec des données, puis partitionne une section du disque égale à 25 % de la capacité du disque pour simuler la façon dont le disque pourrait répondre aux charges de travail des applications. Cela diffère des tests d'entropie complète, qui utilisent 100 % du disque et les amènent à un état stable. Par conséquent, ces chiffres refléteront des vitesses d'écriture soutenues plus élevées.
Profils :
- Lecture aléatoire 4K : 100 % lecture, 128 threads, 0-120 % iorate
- Écriture aléatoire 4K : 100 % écriture, 128 threads, 0-120 % iorate
- Lecture aléatoire 64K : 100 % lecture, 128 threads, 0-120 % iorate
- Écriture aléatoire 64K : 100 % écriture, 128 threads, 0-120 % iorate
- Lecture séquentielle 16K : 100 % lecture, 32 threads, 0-120 % iorate
- Écriture séquentielle 16K : 100 % écriture, 16 threads, 0-120 % iorate
- Lecture séquentielle 64K : 100 % lecture, 32 threads, 0-120 % iorate
- Écriture séquentielle 64K : 100 % écriture, 16 threads, 0-120 % iorate
- Mélange aléatoire 4K, 8K et 16K 70R/30W, 64 threads, 0-120 % iorate
- Base de données synthétique : SQL et Oracle
- Traces VDI Full Clone et Linked Clone
Dans notre première analyse de charge de travail VDBench, en lecture aléatoire 4K, le PBlaze7 7940 a enregistré un pic de seulement 1,1 million d'IOPS (à 183,2 µs), tandis que le KIOXIA CM7 a plus que doublé ce nombre avec 2,7 millions d'IOPS à une latence de 188,6 µs.
![]() Pour l'écriture aléatoire 4K, le PBlaze7 7940 a donné de bien meilleurs résultats avec 831K IOPS à 611,7 µs, tandis que le KIOXIA CM7 a atteint un pic de 948K IOPS avec une latence de 537,4 µs.
Pour l'écriture aléatoire 4K, le PBlaze7 7940 a donné de bien meilleurs résultats avec 831K IOPS à 611,7 µs, tandis que le KIOXIA CM7 a atteint un pic de 948K IOPS avec une latence de 537,4 µs.
En passant aux charges de travail séquentielles 64k, le PBlaze7 7940 a affiché des performances impressionnantes. En lecture, il a atteint un pic de 216K IOPS (13,5 Go/s) avec une latence de 295,4 µs. C'était nettement mieux que le disque KIOXIA, qui a atteint un pic de 11,4 Go/s (182K IOPS) avec une latence de 349,5 µs en activité de lecture.
En écriture séquentielle, le PBlaze7 7940 a surpassé le disque KIOXIA, atteignant un pic de 4,28 Go/s (69K IOPS) à une latence de 928,8 µs. Le disque CM7 a atteint un pic de 4,18 Go/s en écriture (67K IOPS) à 951,7 µs de latence.
Viennent ensuite les tests 16K. En lecture séquentielle, le PBlaze7 7940 a démontré un pic de seulement 161K IOPS (2,5 Go/s) à 191,3 µs, tandis que le KIOXIA CM7 a atteint un impressionnant 352K IOPS (5,5 Go/s) à 90,7 µs.
![]() En écriture séquentielle 16K, le PBlaze7 7940 a montré un pic de 193K IOPS (3,01 Go/s) à 80,9 µs, tandis que le SSD KIOXIA a atteint 242K IOPS (3,79 Go/s) à seulement 63,9 µs.
En écriture séquentielle 16K, le PBlaze7 7940 a montré un pic de 193K IOPS (3,01 Go/s) à 80,9 µs, tandis que le SSD KIOXIA a atteint 242K IOPS (3,79 Go/s) à seulement 63,9 µs.
Passons maintenant à nos profils de lecture/écriture mixtes, en commençant par le 70/30 4K. La performance maximale du PBlaze7 7940 a atteint 562K IOPS à 110 µs. Le disque KIOXIA CM7 a, comme prévu, obtenu de meilleurs résultats à 881K IOPS à 71,6 µs.
![]() Dans les résultats du test 8k 70/30, le PBlaze7 7940 a atteint un pic de 443K IOPS à 143,3 µs par rapport aux 597K IOPS du KIOXIA CM7 à 106,1 µs.
Dans les résultats du test 8k 70/30, le PBlaze7 7940 a atteint un pic de 443K IOPS à 143,3 µs par rapport aux 597K IOPS du KIOXIA CM7 à 106,1 µs.
Dans le profil 70/30 16K, le PBlaze7 7940 a atteint 327K IOPS à 195,6 µs, tandis que le KIOXIA CM7 a terminé le test à 350K IOPS à 181,4 µs.
Les deux tests suivants sont des benchmarks aléatoires 64k. En lecture, le PBlaze7 7940 a affiché un très impressionnant et stable 188K IOPS à 170,1 µs, ce qui était plus du double des 81K IOPS du disque KIOXIA à 219,2 µs (qui a également connu un pic de performance assez marqué à la fin du test).
En écriture aléatoire 64k, les disques Memblaze et KIOXIA étaient au coude à coude, bien que le 7940 ait pris l'avantage à la fin avec 64K IOPS à 245,1 µs de latence. En comparaison, le disque KIOXIA CM7 a atteint un pic de 63K IOPS avec une latence de 247,6 µs.
Notre prochain ensemble de tests concerne nos charges de travail SQL : SQL, SQL 90-10 et SQL 80-20. En commençant par la charge de travail SQL standard, le PBlaze7 7940 a enregistré un pic de 429K IOPS avant de connaître un pic de performance à la fin, tandis que le KIOXIA CM7 a atteint un pic de 382K IOPS avec une latence de 83,5 µs.
En SQL 90-10, les deux disques Gen5 ont eu des performances quasi identiques. Ici, le PBlaze7 7940 a atteint 392K IOPS à la fin du test avec une latence de 81,2 µs, tandis que le KIOXIA a atteint un pic de 397K avec une latence de 80,2 µs.
Avec SL 80-20, le PBlaze7 a atteint un pic de 366K IOPS avec une latence de 87 µs. En comparaison, le KIOXIA CM7 a enregistré un pic de performance de 298K IOPS à 73,5 µs.
Viennent ensuite les charges de travail Oracle (Oracle, Oracle 90-10 et Oracle 80-20). En commençant par la charge de travail Oracle générale, le PBlaze7 7940 a eu une performance de pointe de 361K IOPS (98 µs), tandis que le KIOXIA CM7 a atteint un pic de 416K IOPS à 85,1 µs.
![]() En regardant Oracle 90-10, le PBlaze7 7940 et le KIOXIA CM7 ont à nouveau eu des performances quasi identiques, le premier atteignant un pic de 293K IOPS (74,9 µs) tandis que le second a enregistré une performance de pointe de 298K IOPS (73,5 µs).
En regardant Oracle 90-10, le PBlaze7 7940 et le KIOXIA CM7 ont à nouveau eu des performances quasi identiques, le premier atteignant un pic de 293K IOPS (74,9 µs) tandis que le second a enregistré une performance de pointe de 298K IOPS (73,5 µs).
Vient ensuite Oracle 80-20, où le PBlaze7 7940 a atteint un pic de 280K IOPS avec une latence de 78,2 µs. En comparaison, le CM7 a atteint un pic de 310K IOPS avec une latence stable de 70,6 µs.
Ensuite, nous sommes passés à notre test de clone VDI, Full et Linked. VDI Full Clone (FC) Boot 7940 a atteint un pic de 360K IOPS avec une latence de 97,3 µs (bien qu'il ait eu un léger problème de performance à la fin). En comparaison, le KIOXIA CM7 a atteint un pic de 335K IOPS avec une latence de 103 µs.
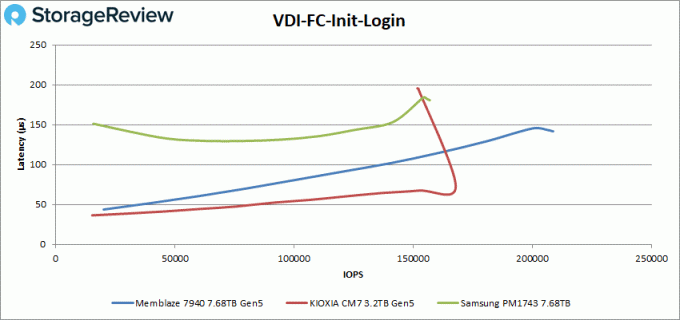
Lors de la connexion initiale VDI FC, le PBlaze7 7940 a atteint 209K IOPS (141,7 µs), tandis que le disque KIOXIA CM7 a légèrement reculé, atteignant un pic de 168K IOPS avec une latence de 73,2 µs avant de connaître un pic de performance significatif à la toute fin du test.
Personne à contacter: Ms. Sandy Yang
Téléphone: 13426366826